

Index of Private Housing Rental Prices, UK: may 2019
An experimental price index tracking the prices paid for renting property from private landlords in the UK.
1.Main points
- Private rental prices paid by tenants in the UK rose by 1.3% in the 12 months to May 2019, up from 1.2% in April 2019.
- In England, private rental prices grew by 1.3%, Wales experienced growth of 1.1%, while in Scotland private rental prices increased by 0.8% in the 12 months to May 2019.
- London private rental prices rose by 0.9% in the 12 months to May 2019, up from 0.5% in April 2019.
2.Things you need to know about this release
The IPHRP is constructed using administrative data. That is, the index makes use of data that are already collected for other purposes to estimate rental prices. The sources of private rental prices are Valuation Office Agency (VOA), Scottish Government (SG), Welsh Government (WG) and Northern Ireland Housing Executive (NIHE). All these organisations deploy rental officers to collect the price paid for privately rented properties. Data for Northern Ireland also include data provided by propertynews.com.
Annually, over 450,000 private rents prices are collected in England, 30,000 in Wales, 25,000 in Scotland and 15,000 in Northern Ireland. The sources of expenditure weights are the Ministry of Housing, Communities and Local Government (MHCLG), Scottish Government, Welsh Government, Northern Ireland Housing Executive and the VOA.
IPHRP is released as an Experimental Statistic. While the methodologyfor IPHRP is final, Northern Ireland data were previously excluded from the price index. We have since worked with the Northern Ireland Housing Executive to secure private rental data for Northern Ireland with results first published in our August 2018 release on 19 September 2018. We have also used these data to improve the coverage of IPHRP to that of the UK, which was published for the first time in our September 2018 release on 17 October 2018.
The IPHRP is scheduled to be assessed against the Code of Practice for Statistics in 2019 with the aim of achieving National Statistics status for the release.
3.UK private rental prices growth rate strengthens
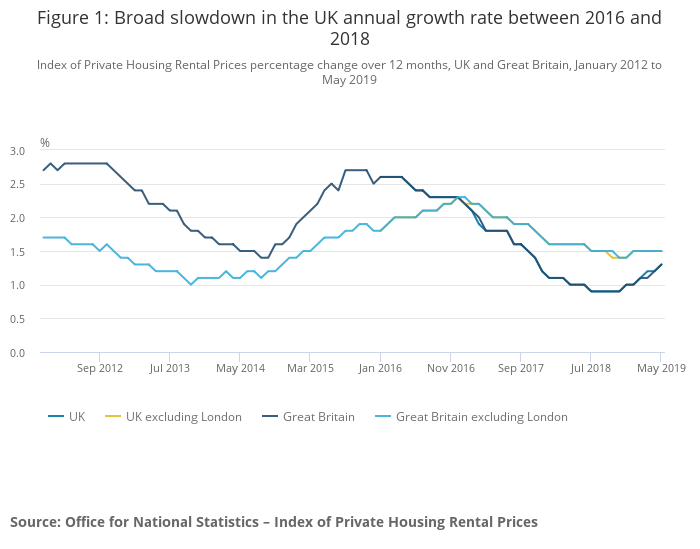
Private rental prices paid by tenants in the UK increased by 1.3% in the 12 months to May 2019, up from 1.2% in April 2019. For example, a property that was rented for £500 per month in May 2018, which saw its rent increase by the average rate in the UK, would be rented for £506.50 in May 2019. Growth in private rental prices paid by tenants in the UK has generally slowed since the beginning of 2016, driven mainly by a slowdown in London over the same period. Rental growth has started to pick up since the end of 2018, driven by strengthening growth in London.
Rental prices for the UK excluding London increased by 1.5% in the 12 months to May 2019, unchanged since January 2019 (Figure 1). London private rental prices increased by 0.9% in the 12 months to April 2019, up from 0.5% in April 2019.
The Royal Institution of Chartered Surveyors’ (RICS’s) April 2019 Residential Market Survey reported that tenant demand continued to rise gently while supply (new landlord instructions) slipped further, remaining in negative territory since the middle of 2016.
The Association of Residential Letting Agents (ARLA) reported in their Private Rented Sector Report for April 2019 that the supply of rental properties and demand from prospective renters decreased.
These supply and demand pressures can take time to feed through to the Index of Private Housing Rental Prices (IPHRP), which reflects price changes for all private rental properties, rather than only newly advertised rental properties.
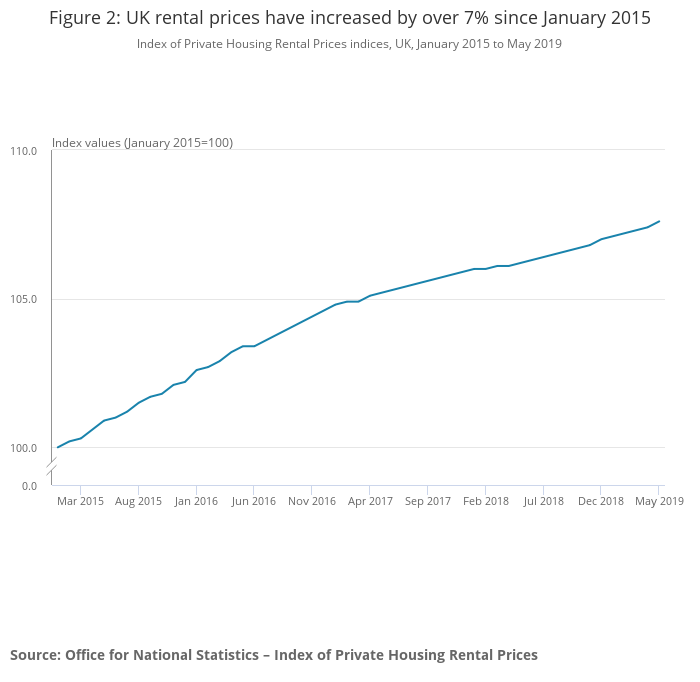
Focusing on the long-term trend, between January 2015 and May 2019, private rental prices in the UK increased by 7.6% (Figure 2).
4.How do growth rates compare at the country level?
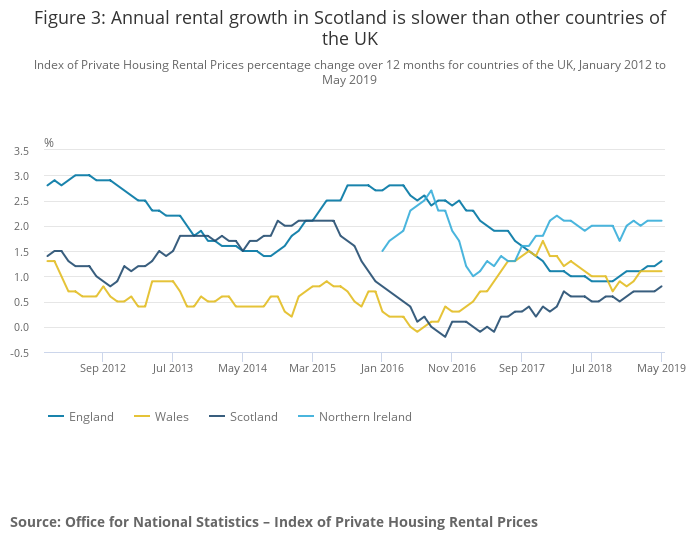
In England, private rental prices grew by 1.3% in the 12 months to May 2019, up from 1.2% in April 2019. When London is excluded from England, privately rented properties increased by 1.5% in the 12 months to May 2019.
Private rental prices in Wales grew by 1.1% in the 12 months to May 2019, unchanged since February 2019. Rental growth in Scotland increased by 0.8% in the 12 months to May 2019, up from 0.7% in April 2019. The weaker growth in Scotland since 2016 may be due to stronger supply and weaker demand in Scotland, as reported by the Association of Residential Letting Agents (ARLA).
The annual rate of change for Northern Ireland (2.1%) in March 2019 was higher than the other countries of the UK. The Northern Ireland annual growth rate has remained broadly consistent at around 2% since 2018. Northern Ireland data have been copied forward since March 2019. The next update to Northern Ireland data will be in the release on 18 September 2019.
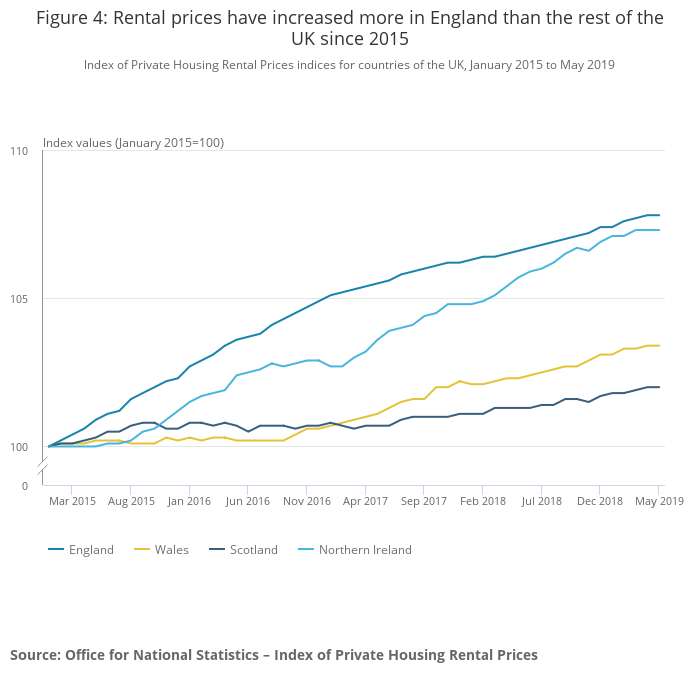
All UK countries have experienced rises in their private rental prices since 2015 (Figure 4). Since January 2015, rental prices in England have increased more than those in Wales, Scotland and Northern Ireland.
5.Growth in London private rental prices strengthening since mid-2018
London private rental prices increased by 0.9% in the 12 months to May 2019, up from 0.5% in the 12 months to April 2019, its highest annual growth since September 2017. The Royal Institution of Chartered Surveyors (RICS) reported in their September 2018 Residential Market Survey that tenant demand has staged a sustained recovery in London, increasingly outstripping supply. These effects may be now starting to feed through to the Index of Private Housing Rental Prices.
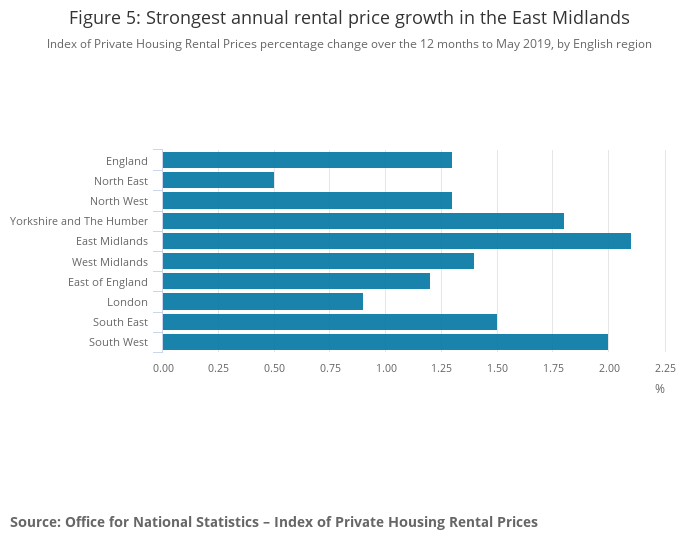
Focusing on the English regions, the largest annual rental price increase was in the East Midlands (2.1%), unchanged from April 2019 (Figure 5). This was followed by the South West (2.0%), up from 1.7% in April 2019 and Yorkshire and The Humber (1.8%), unchanged since February 2019.
The lowest annual rental price growth was in the North East, where prices increased by 0.5%, up from 0.4% in April 2019. It was followed by London, which increased by 0.9%, up from 0.5% in April 2019.
6.Links to related statistics
There are many other statistics available for rental and housing prices.
The Valuation Office Agency (VOA) publishes private rental market statistics. These cover the average prices paid for renting private housing in England to the level of region and local authority. The composition of the sample used for this publication varies over time and therefore makes it hard to produce reliable comparisons over different time periods. For an evaluation of our rental price indices and the growth in average private rental prices published by the VOA, please see the article Explaining private rental growth (PDF, 446KB).
The Ministry of Housing, Communities and Local Government(MHCLG) publishes social rent statistics. These cover average prices paid for renting both local authority and private registered provider (housing association) properties in England. These are collected from the continuous recordings of lettings and sales in social housing (CORE) and are available at regional and local authority level.
Scottish Government publishes social rent statistics for Scotland. These cover the average weekly rents paid for local authority and registered social landlords and are available at area level. Private Sector Rent Statistics are also published annually, which cover the average price paid for renting private housing in Scotland.
Welsh Government publishes social rent statistics for Wales. These cover the average weekly rents paid for local authority and registered social landlords and are available at area level. Private sector rents are also published on an annual basis, which cover the average price paid for renting private housing in Wales.
Northern Ireland Housing Executive with Ulster University publishes a bi-annual summary Research Report on the Performance of the rental market in Northern Ireland. This report analyses trends in the private rental sector at district council level during a six-month period.
In addition to government sources, a number of private companies such as Countrywide, Homelet and LSL Property Services produce statistics on the private rental market. These are predominantly flow measures of private rents, whereas the Index of Private Housing Rental Prices (IPHRP) is a stock measure. More information on how these compare with IPHRP can be found in the article Private rental growth measure, a UK comparison.
A detailed guide (XLS, 43KB) to wider housing and planning statisticshas also been published by the Government Statistical Service.
7.Quality and methodology
The Index of Private Housing Rental Prices Quality and Methodology Information report contains important information on:
- the strengths and limitations of the data and how it compares with related data
- uses and users of the data
- how the output was created
- the quality of the output including the accuracy of the data
Private rental growth measures, a UK comparison compares the growth in the Index of Private Housing Rental Prices to other measures of private rental growth.
Quality assurance of administrative data used in private rental housing statistics documents the administrative data sources used in the production of the Index of Private Housing Rental Prices and the quality assurance processes applied to them.